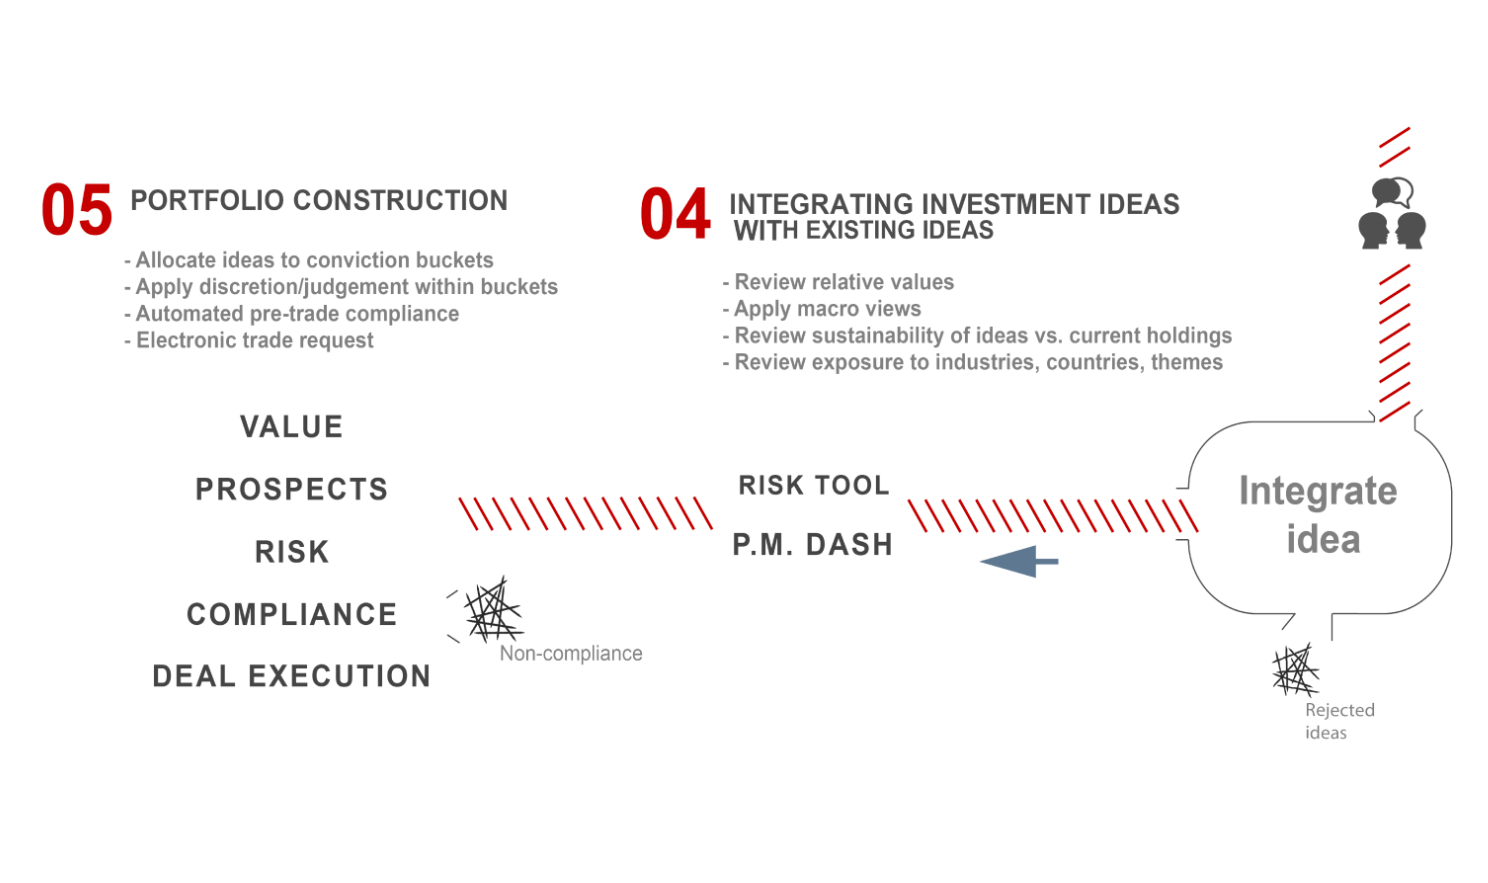
Once a particular investment idea has been approved by our portfolio management team, it is then considered for inclusion into the relevant funds. This is the start of Portfolio Construction, which is the 4th and 5th steps of our investment process:
Principles
The following outlines some of the details / principles of our portfolio construction process.
- Rob Spanjaard has final responsibility for the construction of the portfolios. We do not believe investment decisions through an investment committee is an effective method to implement decisions. It is key that a particular individual in the process is held accountable for their decisions, and not a committee as a whole.
- We are a high conviction manager with relatively few holdings compared to our peers. Only conviction buys are included in the portfolio.
- The process is completely benchmark agnostic.
- Where a share has a low allocation, it is generally where we are buying into the position or reducing our exposure in that position.
- Investments showing the greatest potential reward versus risk taken have the highest weighting.
- We view shares as portions of a business rather than financial assets.
- Each idea’s suitability is reviewed versus current holdings to avoid concentration to any particular themes, sectors, countries etc.
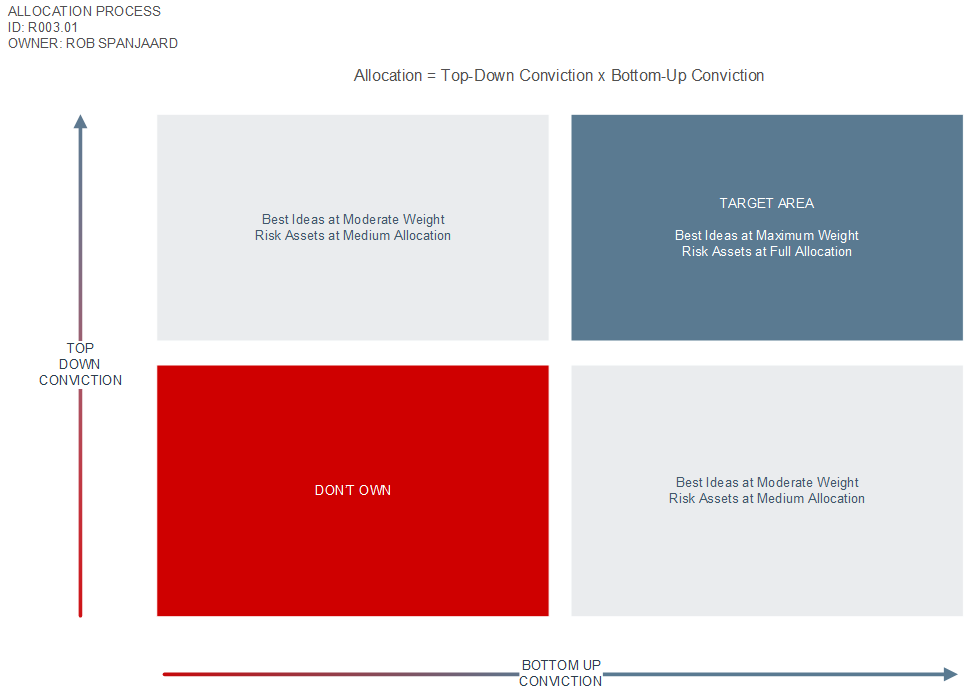
Asset Allocation
The following diagram outlines how we use a combination of top-down and bottom-up conviction levels to determine the allocation of a particular security.
Bottom-Up Conviction Buckets
Based on our level of conviction of a particular investment idea, we will allocate according to the following conviction buckets:
| Level of Conviction | Exposure Range |
|---|---|
| High | 5% – 10% |
| Medium | 2% – 5% |
Top-Down Conviction Buckets
As part of our top-down approach to allocations, we use the following elements to determine the final allocation of a particular investment idea:
- Asset Class Exposure
- Currency Exposure
- Sector Exposure
- Leading & Lagging Indicators
Asset Class exposure
Subject to the relevant mandate restrictions, we follow an active asset allocation philosophy and will for example, use exposure to defensive asset classes to protect on the downside. For example, in mid 2008, we significantly reduced exposure growth assets and subsequently protected capital through active asset allocation.
| Asset Class | Level of Conviction | Rezco Stable Fund | Rezco Value Trend Fund | Rezco Managed Plus Fund | Rezco Equity Fund |
|---|---|---|---|---|---|
| Equities | High | 40% | 75% | 75% | 100% |
| Medium | 30% | 50% | 60% | 95% | |
| Low | 5% | 10% | 15% | 90% | |
| Property | High | 15% | 20% | 25% | 25% |
| Medium | 7.5% | 12.5% | 15% | 15% | |
| Low | 0% | 0% | 0% | 0% | |
| Bonds (Duration) | High | 7 years | 7 years | 7 years | n/a |
| Medium | 3 years | 3 years | 3 years | ||
| Low | <1 year | <1 year | <1 year |
Currency Exposure
| Currency | Level of Conviction | Rezco Stable Fund | Rezco Value Trend Fund | Rezco Managed Plus Fund | Rezco Equity Fund |
|---|---|---|---|---|---|
| Foreign | High | 30% | 30% | 30% | 0% |
| Medium | 20% | 20% | 20% | ||
| Low | 0% | 0% | 0% |
Sector Exposure
| Sector | Level of Conviction | Rezco Stable Fund | Rezco Value Trend Fund | Rezco Managed Plus Fund | Rezco Equity Fund |
|---|---|---|---|---|---|
| Mega | High | 25% | 30% | 30% | 30% |
| Medium | 15% | 15% | 15% | 20% | |
| Low | 0% | 0% | 0% | 0% | |
| Non-Mega | High | 15% | 15% | 15% | 15% |
| Medium | 10% | 10% | 10% | 10% | |
| Low | 0% | 0% | 0% | 0% |
Leading and Lagging Indicators
“Leading – These types of indicators signal future events. Think of how the amber traffic light indicates the coming of the red light. In the world of finance, leading indicators work the same way but are less accurate than the street light. Bond yields are thought to be a good leading indicator of the stock market because bond traders anticipate and speculate trends in the economy (even though they aren’t always right).
Lagging – A lagging indicator is one that follows an event. Back to our traffic light example: the amber light is a lagging indicator for the green light because amber trails green. The importance of a lagging indicator is its ability to confirm that a pattern is occurring or about to occur. Unemployment is one of the most popular lagging indicators. If the unemployment rate is rising, it indicates that the economy has been doing poorly.” Source: Investopedia
The following table outlines a few examples of the leading and lagging indicators we are taking into account when integrating a particular investment idea:
| Leading | Lagging |
|---|---|
| Bond yields | Unemployment |
| Foreign flows | Inflation |
| Country current accounts | Currency |
| Job statistics | Price movements |
| Industry head/tailwinds | Interest rates |
| Quality of management | |
| Earnings exposure |
Investment Process
STEP 01 Sources of Information
STEP 02 Sort, Process & Filter
STEP 03 Refine Idea
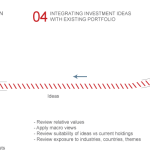
STEP 04 Integrate Idea
STEP 05 Portfolio Construction
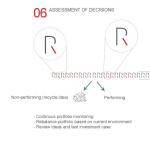
STEP 06 Assessment